Gender Mobility
The gender balance in employee inflow, advancement, and outflow provides important insight into an organization’s diversity and inclusiveness. Gaining a clear understanding of how men and women move within the organization – gender mobility - is essential for any company committed to fostering diversity and inclusion. Analyzing these patterns helps to address key questions such as:
- Are enough women being hired to sustain diversity?
- Do women have the same opportunities for promotion as men?
- Is there evidence of a glass ceiling?
- Does the organization face greater challenges in engaging women?
- What is the likelihood of achieving diversity goals?

Our approach
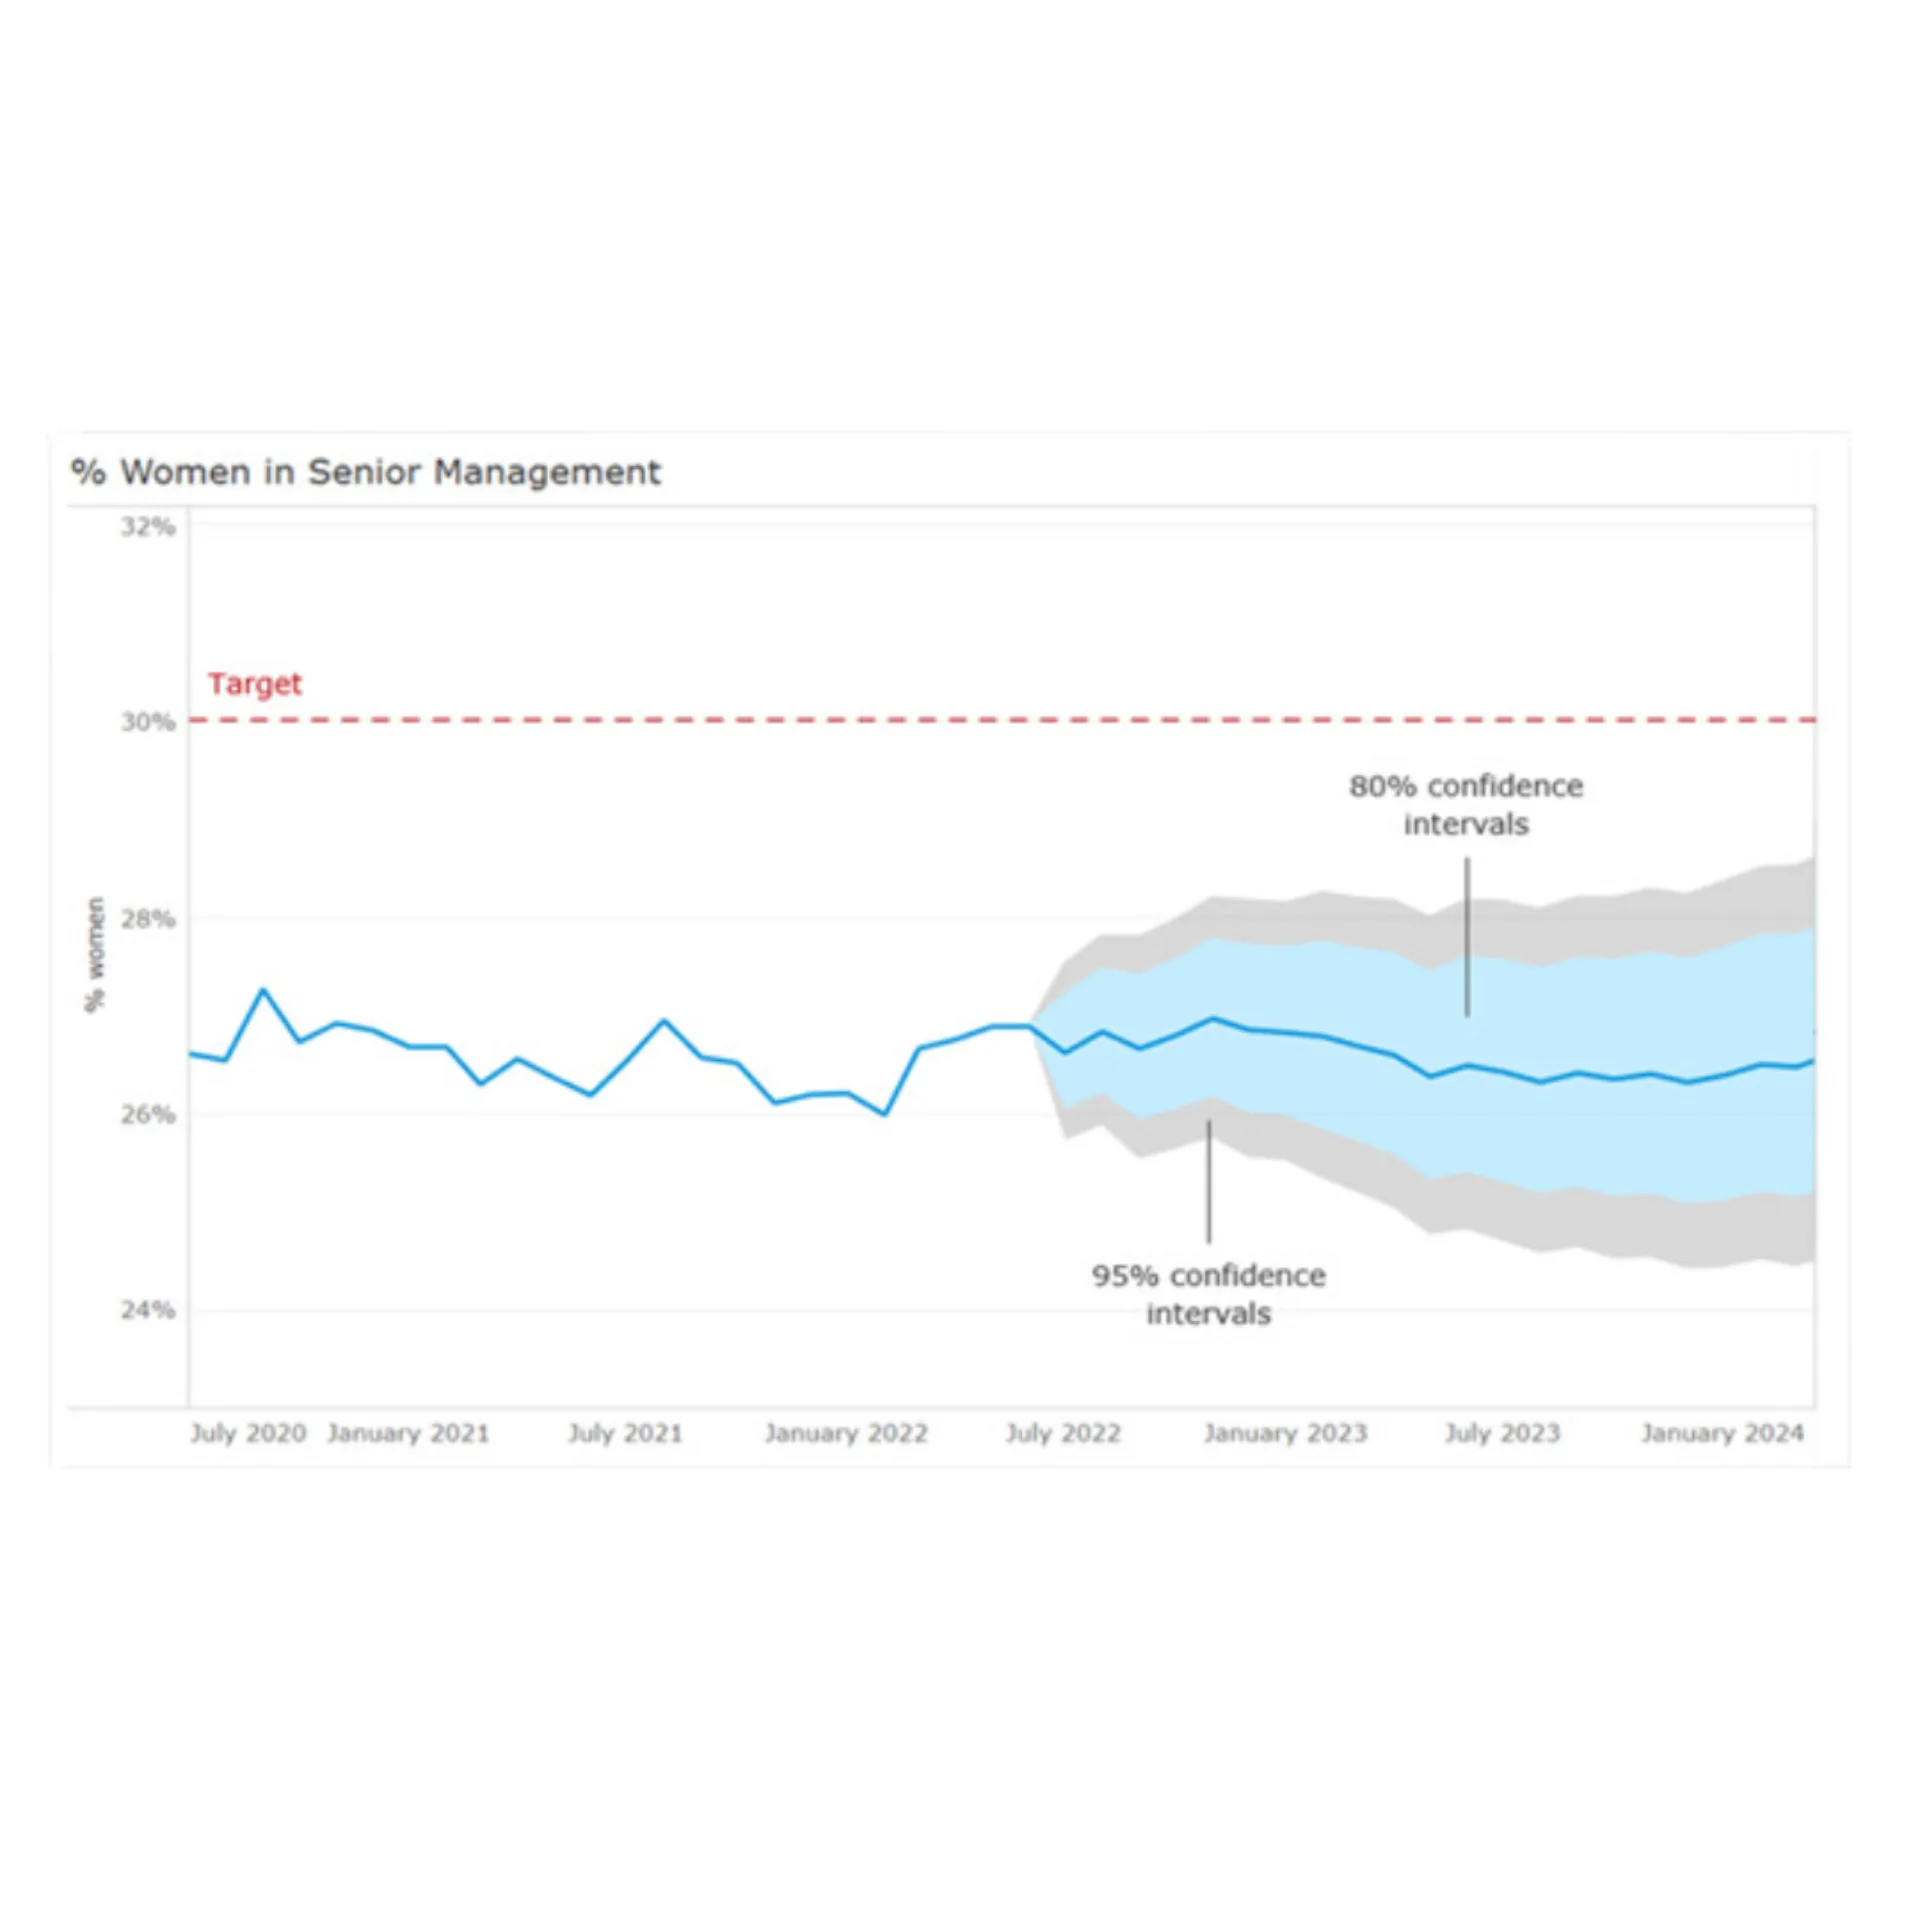
Based on data from the HR personnel system, Highberg creates a visualized dashboard for your organization that answers the questions above. Differences between men and women are tested statistically, so it becomes clear which differences are significant and which may be coincidental. Predictions are also made using predictive analytics to provide insight into what the male/female ratio will look like in the future if the current situation is maintained.
In the final product, a PowerBI dashboard, the user gets an overview of the entire organization and can zoom in on certain employee segments. This could include young people, new hires, a particular job area such as IT or an accumulation of factors (young people who have just started in IT).
Result
Research shows that better diversity combined with inclusiveness leads to higher innovation rates, higher productivity and lower turnover. With this scan, an organization gains insight into the mobility patterns (inflow, advancement and outflow) of men and women.
Based on these patterns, policy adjustments can be made and actions taken that increase the organization's diversity and inclusiveness.
Diversity at the top prediction model
A good gender balance at the top of an organization often says something about the diversity in the rest of the organization. It is also a positive sign to potential employees that men and women have equal opportunities to grow into higher management positions. Many organizations state in their diversity policy that they want to grow towards an equal or more equal distribution in top management. In addition, in the Netherlands, alongside many other countries, it is mandatory for listed companies to have at least 30 per cent men and women on their supervisory boards.
Knowing whether enough women are advancing in an organization and whether goals are being met is an important issue. The 'women to the top' prediction model of Highberg gives an overview for the entire organization and shows to what extent it is realistic that targets regarding women in top positions will be met.

Related insights

